This post goes into the issues I remember facing when I tried to optimize a WordPress website by profiling it with Xdebug. I’m just describing my experience. These might not be actual issues with Xdebug, but rather with my knowledge level and approach, but hopefully some of the insight is useful.
What are cycles?
My goal was to figure out which functions take up most execution time and see how I could write a WordPress plugin to optimize the performance. So I did a profiling run with Xdebug and put the results into KCacheGrind.
The results I got looked something like this.
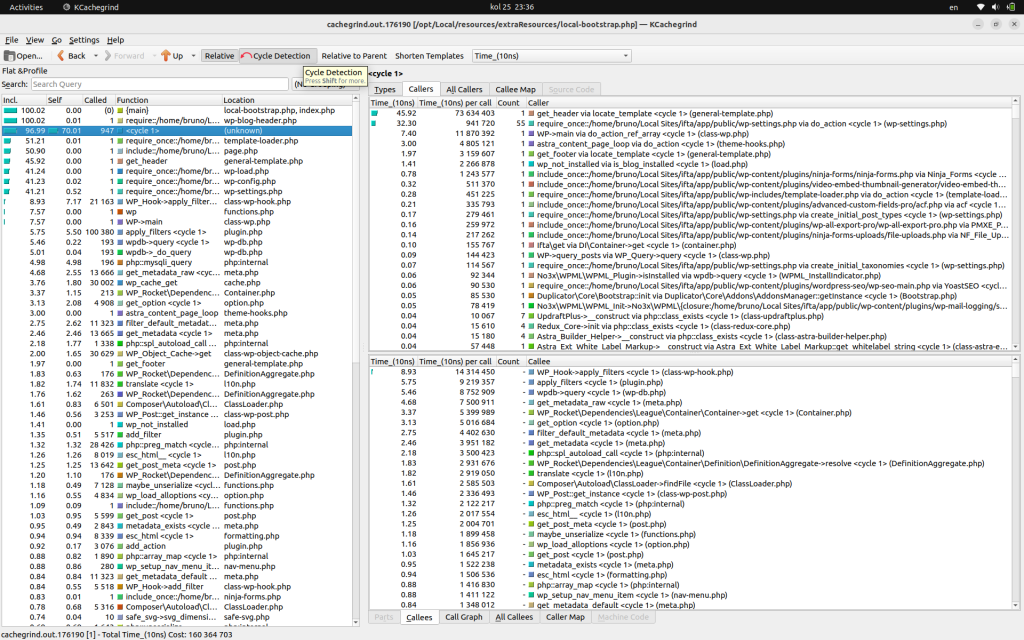
With cycle detection, it appears that this “cycle” is the thing that takes up the vast majority of execution time.
I haven’t been able to figure out how to extract useful information from cycles. How do I figure out which functions / lines of code exactly are taking up most execution time? What are “Callers”? What is the difference between “Callers” and “All Callers”? The callers of a function would make sense but how do the callers of a cycle make sense?
I don’t know what a cycle is. There is this Stack Overflow response about cycles. I tried using that definition to reproduce cycles in simpler scripts, by doing recursion, but it hasn’t worked for me.
Inclusive cost over 100?
If cycle detection is turned off, the information confuses me again. Why is inclusive cost of some functions now over 100%? How can something take up more than 100% of execution time? Perhaps that is not the right interpretation of the number? In that case, documentation such as this is very confusing.
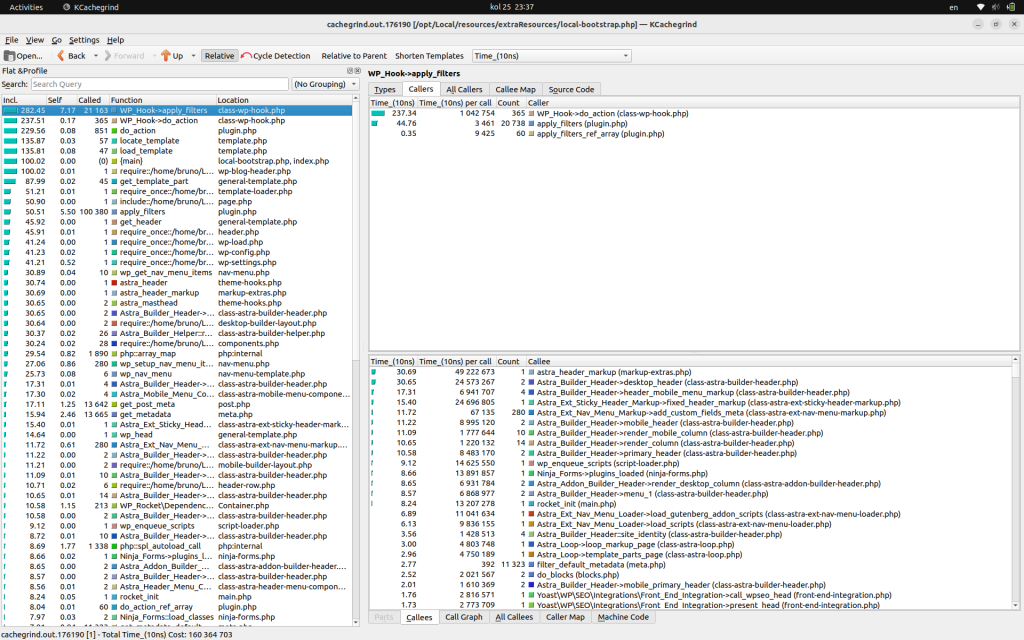
Furthermore, it says that WP_Hook->apply_filters takes up the most time, but that’s just because it’s called most times. How do I see what takes up most time per call?
So how do you profile PHP applications?
I recommend using Blackfire.